Quantify the Risk Behind Major Project Decisions
Qualitative risk ranking and LOPA are appropriate for many process safety decisions. A QRA is useful when the decision requires a more detailed numerical treatment of release frequency, event sequences, physical effects, exposure, and risk. The level of detail should be proportionate to the decision being made and the quality of available data.
A model is only useful when its assumptions, data sources, uncertainties, and decision context are clear. Apparent numerical precision shouldn’t replace engineering judgment.
Need a QRA to support a real decision? Reach out and we’ll help.
Potential QRA Applications
- Facility siting and occupied building location
- New process, terminal, storage, pipeline, or major capital project design
- Comparison of alternative plot plans, separation distances, inventories, or safeguards
- Evaluation of toxic, flammable, and explosion impacts on onsite and offsite receptors
- Assessment of escalation and domino effects between process units
- Land use planning and risk contour development
- Emergency planning and identification of credible high consequence scenarios
- Insurance, investment, acquisition, and enterprise risk decisions
- Prioritization of risk reduction projects across a facility or portfolio
QRA Scope Elements
Hazard identification. Define hazardous materials, equipment, operating modes, release locations, and credible loss of containment scenarios.
Frequency analysis. Estimate release and initiating event frequencies using documented data and equipment population assumptions.
Event sequence modeling. Use event trees or equivalent logic to represent isolation, ignition, weather, mitigation, escalation, and outcome pathways.
Consequence modeling. Estimate toxic dispersion, flammable dispersion, thermal radiation, blast overpressure, or other physical effects.
Exposure and vulnerability. Evaluate occupancy, exposure duration, receptor distribution, building response, and selected harm criteria.
Risk calculation. Calculate scenario risk and, where required, aggregate individual risk, societal risk, or geographic risk contours.
Sensitivity and uncertainty. Test influential assumptions and explain how uncertainty affects the decision.
Risk reduction evaluation. Compare design or operating alternatives using consistent assumptions and metrics.
Fire, Explosion, and Toxic Consequence Modeling
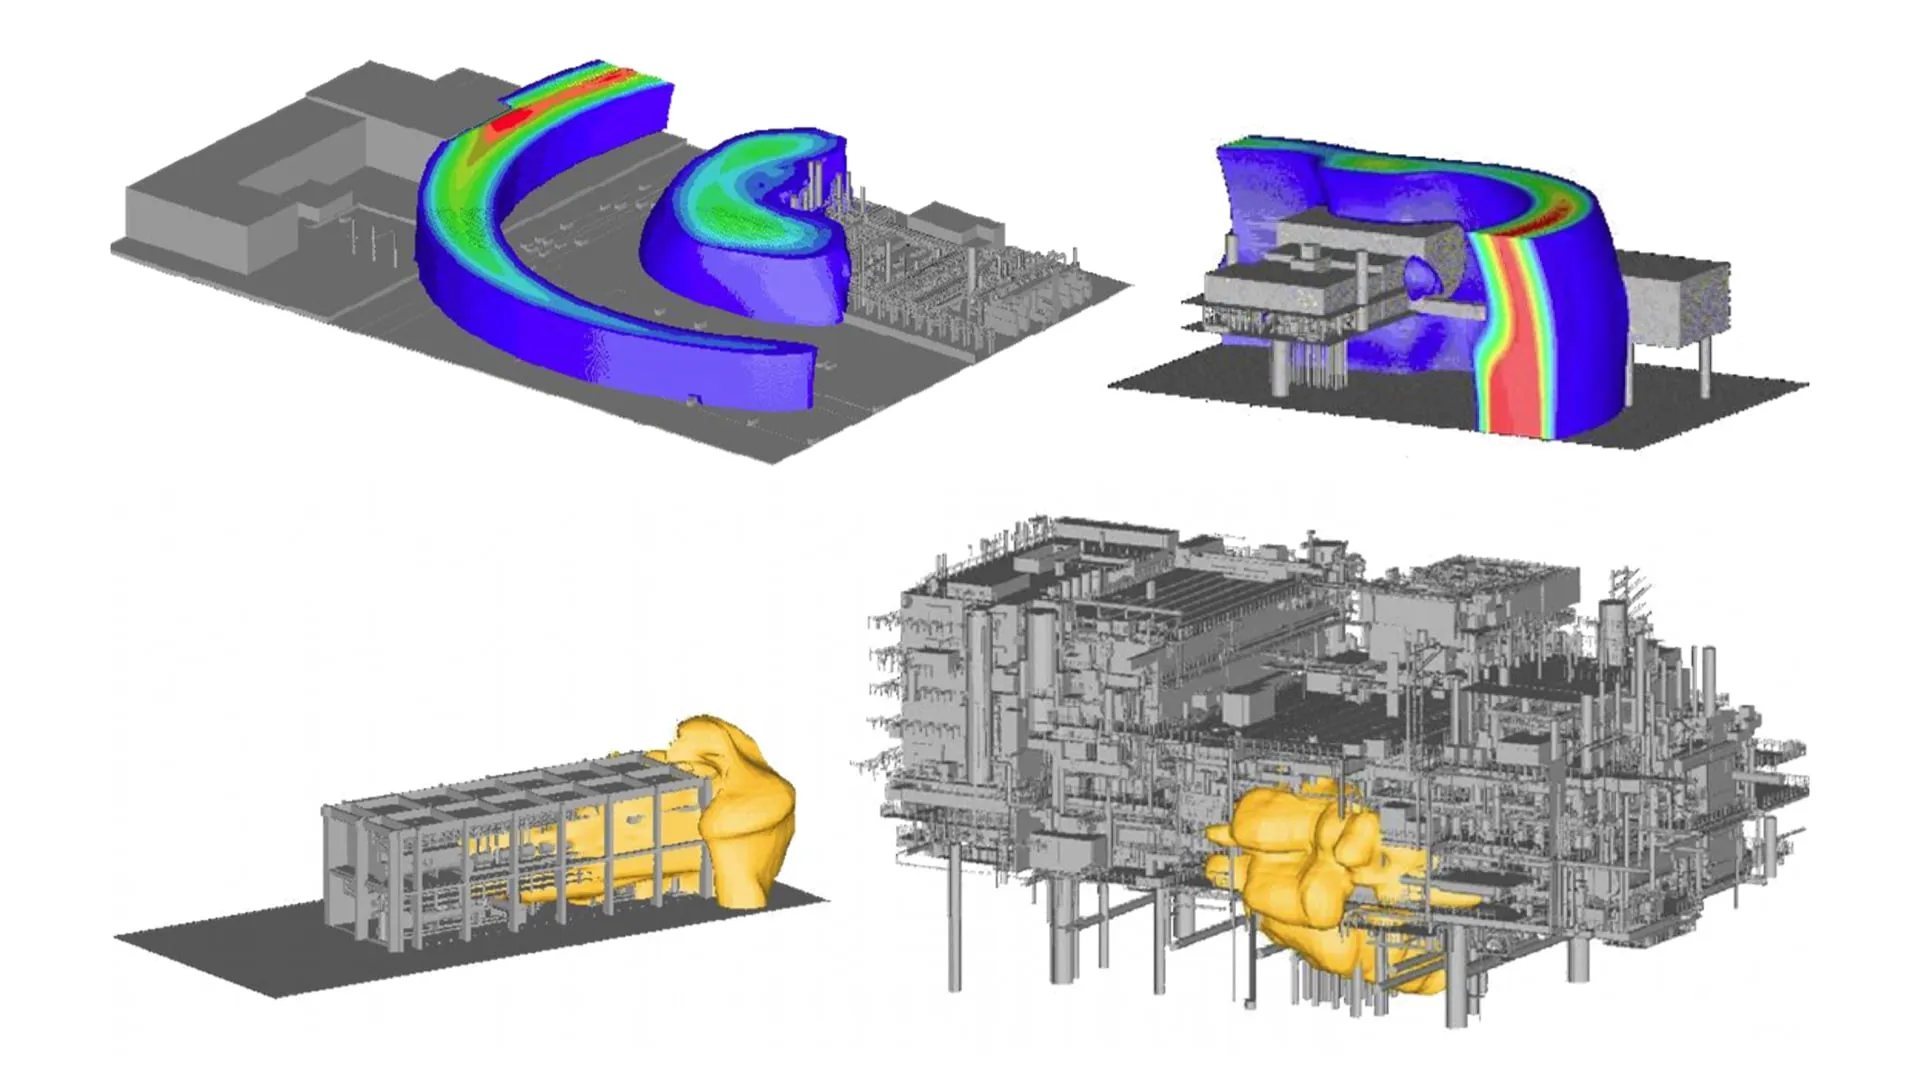
Depending on the materials, process, release conditions, and project objectives, the consequence analysis may evaluate toxic gas or vapor dispersion and concentration duration effects, flammable vapor cloud dispersion and the extent of the flammable region, immediate and delayed ignition outcomes, jet fires, pool fires, flash fires, and fireballs, thermal radiation and exposure duration, vapor cloud explosion or confined explosion overpressure, pressure effects on personnel, buildings, equipment, and critical controls, escalation from fire, explosion, or fragment impact, and indoor infiltration or occupied building exposure, when within scope.
Frequency and Event Tree Analysis
QRA frequency analysis may begin with equipment specific loss of containment frequencies or initiating event frequencies. Event trees then represent how detection, isolation, ignition timing, weather, mitigation, emergency response, and escalation can lead to different outcomes. Data selection should match the equipment type, service, hole size category, operating environment, and definition of the modeled event.
Risk Metrics
Scenario frequency. The estimated frequency of a defined release and outcome.
Location-specific individual risk. The annualized risk to a hypothetical person continuously present at a defined location, subject to the selected methodology.
Individual risk contours. Geographic lines connecting locations with equal calculated individual risk.
Societal risk. A representation of the relationship between accident frequency and number of people affected, often evaluated using an F-N curve or equivalent criterion.
Risk transects or profiles. Risk plotted along a selected line, route, or facility boundary.
Risk contribution. Identification of the scenarios, equipment, materials, or outcomes that dominate the calculated risk.
Risk reduction benefit. Comparison of baseline risk with alternative layouts, inventories, detection, isolation, mitigation, or protection strategies.
Facility Siting and Occupied Building Decisions
QRA can support occupied building and facility siting decisions by combining credible release scenarios with fire, explosion, and toxic effects, occupancy information, and building vulnerability. Depending on the objective, the analysis may compare alternative locations, evaluate building upgrades, identify shelter-in-place or evacuation concerns, and determine which risk contributors should be reduced first.
A regulatory offsite consequence analysis, a consequence-only facility siting study, and a full QRA are not automatically the same deliverable. The proposal should define whether frequency analysis, aggregation, risk contours, societal risk, or only physical effect modeling is required.
Our QRA Work Process
Step 1: Define the Decision and Risk Metrics. Confirm what decision the QRA must support, which receptors and geographic boundaries are included, and which risk criteria or comparison basis will be used.
Step 2: Establish the Study Basis. Collect material properties, inventories, operating conditions, equipment counts, layouts, weather data, occupancy, detection and isolation functions, and available incident or reliability data.
Step 3: Develop the Scenario Set. Select representative equipment, release sizes, operating modes, and event outcomes without omitting credible risk dominant scenarios or creating unnecessary model complexity.
Step 4: Perform Frequency and Consequence Analysis. Apply documented models, assumptions, and data sources consistently.
Step 5: Calculate and Map Risk. Aggregate results as required and develop tables, plots, contours, profiles, or F-N curves appropriate to the scope.
Step 6: Evaluate Sensitivity and Uncertainty. Identify assumptions that materially change the conclusions and avoid presenting unsupported precision.
Step 7: Compare Risk Reduction Options. Model alternative layouts, inventories, isolation times, safeguards, or building strategies using the same basis.
Step 8: Report Conclusions and Limitations. Provide decision focused conclusions, dominant risk contributors, recommended actions, and limitations of the analysis.
Typical QRA Deliverables
- Figures, maps, calculation files, and technical report as agreed
- QRA basis, objectives, boundaries, and acceptance or comparison criteria
- Scenario register and equipment population
- Frequency data, assumptions, and event trees
- Consequence modeling inputs and results
- Individual risk results and contours, where required
- Societal risk results or F-N curves, where required
- Risk contributor ranking and sensitivity analysis
- Comparison of risk reduction alternatives
Why Choose HazBasis
HazBasis delivers quantitative risk assessments that are tailored to the decisions your project needs to support. We combine proven risk assessment methodologies with practical engineering experience to develop transparent, defensible analyses that help clients evaluate design options, demonstrate compliance, and prioritize risk reduction measures. Every study is performed with a clear understanding of the project objectives, appropriate risk criteria, and the limitations of the available data.
Our team works closely with owners, engineering contractors, and project stakeholders to ensure assumptions are documented, models are applied consistently, and conclusions are supported by sound engineering judgment. Whether you’re evaluating facility siting, occupied buildings, major capital projects, or proposed design changes, HazBasis provides technically rigorous QRA studies with clear reporting, practical recommendations, and results you can confidently use to support critical business and safety decisions.
FAQ
What is the difference between QRA and consequence modeling?
Consequence modeling estimates physical effects from defined releases. QRA combines consequence results with frequency and event-sequence information to estimate risk. A project may require consequence modeling without requiring a full QRA.
What is the difference between LOPA and QRA?
LOPA evaluates a defined scenario using simplified frequency and protection-layer assumptions. QRA normally evaluates a broader scenario set with more detailed release frequencies, event trees, physical effects, exposure, and risk aggregation.
Does a QRA produce an exact prediction of accidents?
No. QRA is a structured estimate based on models, data, assumptions, and scenario definitions. Results should be interpreted with sensitivity and uncertainty in mind and used to support—not replace—engineering judgment.
Can QRA be used for facility siting?
Yes. It can evaluate risk at occupied buildings, compare alternative locations, identify dominant scenarios, and quantify the effect of separation, inventory reduction, isolation, mitigation, or building upgrades.
Can HazBasis review a QRA prepared by another consultant?
Yes. An independent review can evaluate scenario selection, frequency data, consequence inputs, event trees, occupancy, aggregation, risk criteria, sensitivity, uncertainty, and whether conclusions are supported by the analysis.
How long does a QRA take?
Schedule depends on the size of the facility, number of materials and equipment items, availability of data, required consequence endpoints, weather cases, occupancy analysis, risk metrics, and number of design alternatives. A scoping phase is normally needed before a reliable schedule and fee can be established.